
Overview
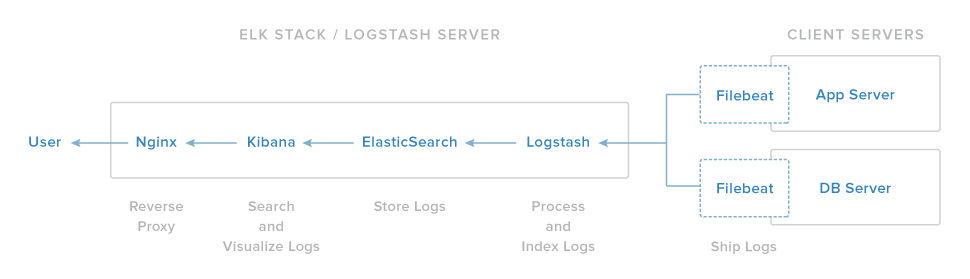
The ELK stack consists of Elasticsearch, Logstash, and Kibana used to centralize the logs. Logstash is an open source tool for collecting, parsing, and storing logs for future use. Kibana is a web interface that can be used to search and view the logs that Logstash has indexed. Both of these tools are based on Elasticsearch, which is used for storing logs.
The ELK Stack has four main components:
- Logstash: The server component of Logstash that processes incoming logs
- Elasticsearch: Stores all of the logs
- Kibana: Web interface for searching and visualizing logs, which will be proxied through Nginx
- Filebeat: Installed on client servers that will send their logs to Logstash, Filebeat serves as a log shipping agent that utilizes the lumberjack networking protocol to communicate with Logstash.
Pre-check the Ubuntu Server release:
$ lsb_release -a
No LSB modules are available.
Distributor ID:	Ubuntu
Description:	Ubuntu 16.04 LTS
Release:	16.04
Codename:	xenial
Install Java 8
Elasticsearch and Logstash require Java, so we will install a recent version of Oracle Java 8 because that is what Elasticsearch recommends.
$ sudo add-apt-repository -y ppa:webupd8team/java

$ sudo apt-get update

$ sudo apt-get -y install oracle-java8-installer

$ java -version
java version "1.8.0_111"
Java(TM) SE Runtime Environment (build 1.8.0_111-b14)
Java HotSpot(TM) 64-Bit Server VM (build 25.111-b14, mixed mode)
Install Elasticsearch
This needs to add elk’s package source list, then install it by pkg manager.
import the Elasticsearch public GPG key into apt:
$ wget -qO - https://packages.elastic.co/GPG-KEY-elasticsearch | sudo apt-key add -
create source list and install:
$ echo "deb http://packages.elastic.co/elasticsearch/2.x/debian stable main" | sudo tee -a /etc/apt/sources.list.d/elasticsearch-2.x.list

$ sudo apt-get update

$ sudo apt-get -y install elasticsearch
We should restrict outside access to ELK server, so can’t read our data or shutdown our Elasticsearch cluster through the HTTP API.
Modify the configuration: /etc/elasticsearch/elasticsearch.yml
#
# Set the bind address to a specific IP (IPv4 or IPv6):
#
network.host: localhost
#
# Set a custom port for HTTP:
#
# http.port: 9200
#
then run the ELK server:
$ sudo service elasticsearch restart

$ sudo update-rc.d elasticsearch defaults 95 10

$ curl localhost:9200
{
  "name" : "The Blank",
  "cluster_name" : "elasticsearch",
  "cluster_uuid" : "4akK1qP2S1OntBkv5OCpHQ",
  "version" : {
    "number" : "2.4.2",
    "build_hash" : "161c65a337d4b422ac0c805f284565cf2014bb84",
    "build_timestamp" : "2016-11-17T11:51:03Z",
    "build_snapshot" : false,
    "lucene_version" : "5.5.2"
  },
  "tagline" : "You Know, for Search"
}
Install logstash
The public GPG key is same as ELK, so just create source list and install.
$ echo 'deb http://packages.elastic.co/logstash/2.4/debian stable main' | sudo tee /etc/apt/sources.list.d/logstash-2.4.x.list
deb http://packages.elastic.co/logstash/2.4/debian stable main

$ sudo apt-get update

$ sudo apt-get install logstash
Configure Logstash
Here we use Filebeat to ship logs from Client to ELK Server, so create an SSL certificate and key pair to verify the identity of ELK Server.
$ sudo mkdir -p /var/lib/logstash/private

$ sudo chown logstash:logstash /var/lib/logstash/private

$ sudo chmod go-rwx /var/lib/logstash/private
If you don’t setup DNS, change /CN=192.168.0.11 to your real server’s private IP address. To avoid TLS handshake error,
add IP to the subjectAltName (SAN) field of the SSL certificate to generate the cert.
$ sudo vi /etc/ssl/openssl.cnf


[ v3_ca ]


# Extensions for a typical CA

subjectAltName=IP:192.168.0.11

$ sudo openssl req -config /etc/ssl/openssl.cnf -x509  -batch -nodes -newkey rsa:2048 -keyout /var/lib/logstash/private/logstash-forwarder.key -out /var/lib/logstash/private/logstash-forwarder.crt -subj /CN=192.168.0.11
remember that copy the cert to all of servers whose logs will be sent to logstash by filebeat.
Logstash configuration consists of three sections: inputs, filters, and outputs.
1. Create a conf file called 02-beats-input.conf and set up the “filebeat” input:
sudo vi /etc/logstash/conf.d/02-beats-input.conf

input {
  beats {
    port => 5044
    ssl => true
    ssl_certificate => "/var/lib/logstash/private/logstash-forwarder.crt"
    ssl_key => "/var/lib/logstash/private/logstash-forwarder.key"
    }
}
The filebeat input is listening on tcp port 5044.
2. Create “filebeat” filter named 10-syslog-filter.conf to add a filter for syslog.
$ sudo vi /etc/logstash/conf.d/10-syslog-filter.conf

filter {
  if [type] == "syslog" {
    grok {
      match => { "message" => "%{SYSLOGTIMESTAMP:syslog_timestamp} %{SYSLOGHOST:syslog_hostname} %{DATA:syslog_program}(?:\[%{POSINT:syslog_pid}\])?: %{GREEDYDATA:syslog_message}" }
      add_field => [ "received_at", "%{@timestamp}" ]
      add_field => [ "received_from", "%{host}" ]
    }
    syslog_pri { }
    date {
      match => [ "syslog_timestamp", "MMM  d HH:mm:ss", "MMM dd HH:mm:ss" ]
    }
  }
}
This filter looks for logs that are labeled as “syslog” type (by Filebeat), and it will try to use grok to parse incoming syslog logs to make it structured
and query-able.
3. Create “filebeat” output named 30-elasticsearch-output.conf
$ sudo vi /etc/logstash/conf.d/30-elasticsearch-output.conf

output {
  elasticsearch {
    hosts => ["localhost:9200"]
    sniffing => true
    manage_template => false
    index => "%{[@metadata][beat]}-%{+YYYY.MM.dd}"
    document_type => "%{[@metadata][type]}"
  }
}
This output basically configures Logstash to store the beats data in Elasticsearch which is running at localhost:9200, in an index named after the beat used (filebeat, in our case).
Test the Logstash configuration:
$ sudo service logstash configtest
log4j:WARN No appenders could be found for logger (io.netty.util.internal.logging.InternalLoggerFactory).
log4j:WARN Please initialize the log4j system properly.
log4j:WARN See http://logging.apache.org/log4j/1.2/faq.html#noconfig for more info.
Configuration OK
Just ignore the log4j WARN and the configuration is OK.
Then run the followng cmd:
# cd /opt/logstash/bin && ./logstash -f /etc/logstash/conf.d/02-beats-input.conf
You will find that the logstash has started a pipeline and processing the syslogs. Once you are sure that logstash is processing the syslogs,
combine 02-beats-input.conf, 10-syslog-filter.conf and 30-elasticsearch-output.conf as logstash.conf in the directory /etc/logstash/
Restart logstash to reload new configuration.
$ sudo service logstash restart

$ sudo update-rc.d logstash defaults 96 9
Install Kibana Dashboard
ELK provides several sample Kibana dashboards and Beats index patterns that can help you get started with Kibana. Although we won’t use the dashboards in this tutorial, we’ll load them anyway so we can use the Filebeat index pattern that it includes.
First, download the sample dashboards archive to your home directory:
$ curl -L -O https://download.elastic.co/beats/dashboards/beats-dashboards-1.1.0.zip

$ unzip beats-dashboards-1.1.0.zip

$ ls beats-dashboards-1.1.0
CHANGELOG.md  dashboards  load.ps1  load.sh  Makefile  README.md  save  screenshots
And load the sample dashboards, visualizations and Beats index patterns into Elasticsearch with these commands:
$ cd beats-dashboards-1.1.0

./load.sh
These are the index patterns that we just loaded:
- [packetbeat-*]
- [topbeat-*]
- [filebeat-*]
- [winlogbeat-*]
download a filebeat index pattern to load:
$ curl -O https://gist.githubusercontent.com/thisismitch/3429023e8438cc25b86c/ raw/d8c479e2a1adcea8b1fe86570e42abab0f10f364/filebeat-index-template.json

$ curl -XPUT 'http://localhost:9200/_template/filebeat?pretty' -d@filebeat-index-template.json
{
  "acknowledged" : true
}
When using Kibana, we will select the Filebeat index pattern as our default. The ELK Server is now ready to receive filebeat data, let’s configure filebeat in client server.
Install filebeat for client
$ echo "deb https://packages.elastic.co/beats/apt stable main" | sudo tee -a /etc/apt/sources.list.d/beats.list

$ sudo apt-get update

$ sudo apt-get install filebeat
modify the existing prospector to send syslog and auth.log to Logstash. Under paths, comment out the - /var/log/*.log file.
This will prevent Filebeat from sending every .log in that directory to Logstash. Then add new entries for syslog and auth.log.
It should look like following:
filebeat:
  # List of prospectors to fetch data.
  prospectors:
    # Each - is a prospector. Below are the prospector specific configurations
    -
      # Paths that should be crawled and fetched. Glob based paths.
      # To fetch all ".log" files from a specific level of subdirectories
      # /var/log/*/*.log can be used.
      # For each file found under this path, a harvester is started.
      # Make sure not file is defined twice as this can lead to unexpected behaviour.
      paths:
        #- /var/log/*.log
        - /var/log/auth.log
        - /var/log/syslog

    # in. Default: log
    document_type: syslog

  # Name of the registry file. Per default it is put in the current working
  # directory. In case the working directory is changed after when running
  # filebeat again, indexing starts from the beginning again.
  registry_file: /var/lib/filebeat/registry

# Multiple outputs may be used.
output:

  ### Elasticsearch as output
  elasticsearch:
    # Array of hosts to connect to.
    # Scheme and port can be left out and will be set to the default (http and 9200)
    # In case you specify and additional path, the scheme is required: http://localhost:9200/path
    # IPv6 addresses should always be defined as: https://[2001:db8::1]:9200
    hosts: ["localhost:9200"]

  ### Logstash as output
  logstash:
    # The Logstash hosts
    hosts: ["192.168.0.11:5044"]

    # Optional TLS. By default is off.
    tls:
      # List of root certificates for HTTPS server verifications
      certificate_authorities: ["/var/lib/logstash/private/logstash-forwarder.crt"]

shipper:


logging:

  # To enable logging to files, to_files option has to be set to true
  files:

    # Configure log file size limit. If limit is reached, log file will be
    # automatically rotated
    rotateeverybytes: 10485760 # = 10MB
Now restart Filebeat to load the conf changes:
$ sudo service filebeat restart
$ sudo update-rc.d filebeat defaults 95 10
And later we can open URL http://ELK-SERVER-IP:5601 or http://ELK-SERVER-DOMAIN-NAME:5601, you will find the syslogs when clicked file-beats-* in the left sidebar.
Install Kibana
$ cd /opt

$ wget https://download.elastic.co/kibana/kibana/kibana-4.5.3-linux-x64.tar.gz

$ sudo tar -xzf kibana-4.5.3-linux-x64.tar.gz # cd kibana-4.5.3-linux-x64/

$ sudo mv kibana-4.5.3-linux-x64 kibana
$ cd /opt/kibana/config
$ sudo vi kibana.yml
Change parameters in /opt/kibana/config/kibana.yml as follows:
server.port: 5601
server.host: "0.0.0.0"
elasticsearch.url: "http://localhost:9200"
run kibana:
/opt/kibana/bin$ sudo ./kibana
  log   [03:31:52.803] [info][status][plugin:kibana] Status changed from uninitialized to green - Ready
  log   [03:31:52.862] [info][status][plugin:elasticsearch] Status changed from uninitialized to yellow - Waiting for Elasticsearch
  log   [03:31:52.888] [info][status][plugin:kbn_vislib_vis_types] Status changed from uninitialized to green - Ready
  log   [03:31:52.902] [info][status][plugin:markdown_vis] Status changed from uninitialized to green - Ready
  log   [03:31:52.911] [info][status][plugin:metric_vis] Status changed from uninitialized to green - Ready
  log   [03:31:52.930] [info][status][plugin:spyModes] Status changed from uninitialized to green - Ready
  log   [03:31:52.936] [info][status][plugin:statusPage] Status changed from uninitialized to green - Ready
  log   [03:31:52.941] [info][status][plugin:table_vis] Status changed from uninitialized to green - Ready
  log   [03:31:52.964] [info][listening] Server running at http://0.0.0.0:5601
  log   [03:31:52.972] [info][status][plugin:elasticsearch] Status changed from yellow to green - Kibana index ready
You can create systemd daemon for kibana using pleaserun (pip install pleaserun):
$ sudo pleaserun -p systemd -v default --install /opt/kibana/bin/kibana -p 5601 -H 0.0.0.0 -e http://localhost:9200
No name given, setting reasonable default based on the executable {:name=>"kibana", :level=>:warn}
Writing file {:destination=>"/etc/default/kibana"}
Writing file {:destination=>"/etc/systemd/system/kibana.service"}
ubuntu@node3:~$ sudo systemctl status kibana.service
- -p specify the port no that kibana will bind
- -H specify the host IP address where Kibana will run.
- -e option specify the elasticsearch IP address.
$ sudo systemctl start kibana.service
$ sudo systemctl status kibana.service
● kibana.service - no description given
   Loaded: loaded (/etc/systemd/system/kibana.service; disabled; vendor preset: enabled)
   Active: active (running) since Fri 2016-12-09 04:02:29 UTC; 2s ago
 Main PID: 7613 (node)
    Tasks: 9
   Memory: 69.4M
      CPU: 2.213s
   CGroup: /system.slice/kibana.service
           └─7613 /opt/kibana/bin/../node/bin/node /opt/kibana/bin/../src/cli -p 5601 -H 0.0.0.0 -e http://localhost:9200

Dec 09 04:02:29 node3 systemd[1]: Started no description given.

$ sudo netstat -pltn| grep '5601'
tcp        0      0 0.0.0.0:5601            0.0.0.0:*               LISTEN      7613/node
Now you can open http://ELK-SERVER-IP:5601 or http://ELK-SERVER-DOMAIN-NAME:5601. After entering the “kibanaadmin” credentials, you should see a page prompting you to configure a default index pattern:
Go ahead and select [filebeat-*] from the Index Patterns menu (left side), then click the Star (Set as default index) button to set the Filebeat index as the default.
Now click the Discover link in the top navigation bar. By default, this will show you all of the log data over the last 15 minutes.
You should see a histogram with log events, with log messages below:
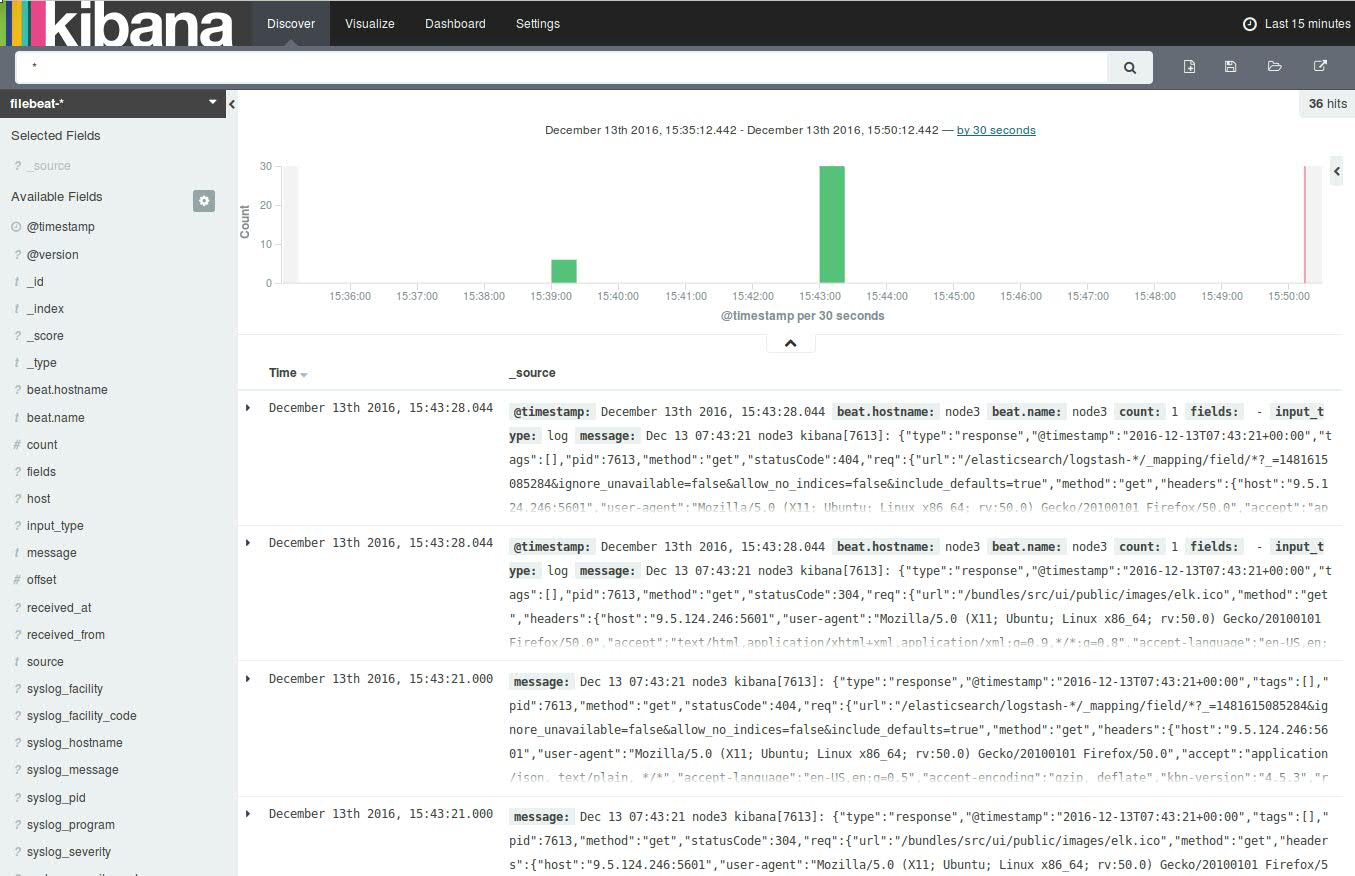
未完待续……